Overview
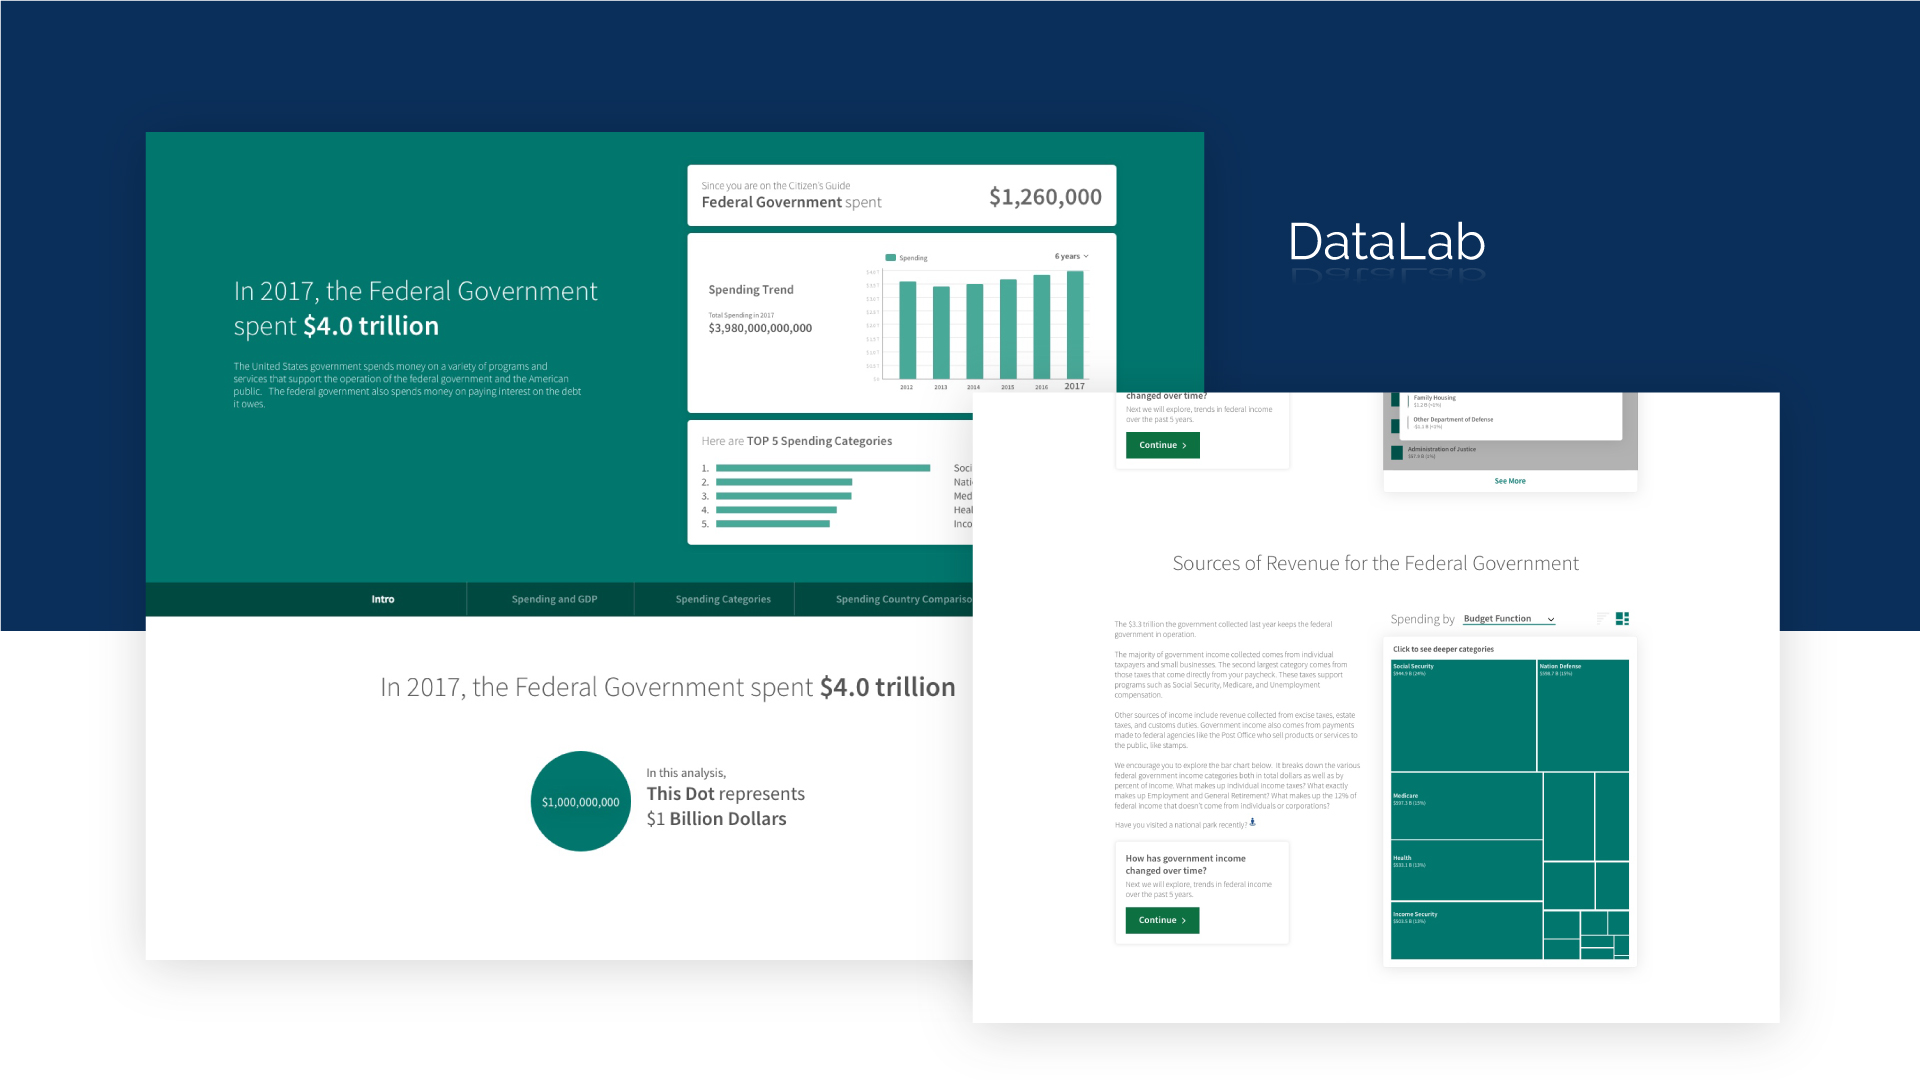
DataLab is the government website for the DataAct from the Bureau of Fiscal Service, Department of Treasury to educate everyday citizens for their better understanding of government finance with the introduction of different topics by translating government data to data visualization.
“To provide engaging and informative data-driven analyses into federal spending data.”
About
- Lead UI/UX Designer
- 1 year 6 months (03/2018 – 09/2019)
- Agile & Scrum – 2 Weeks Sprint
Values
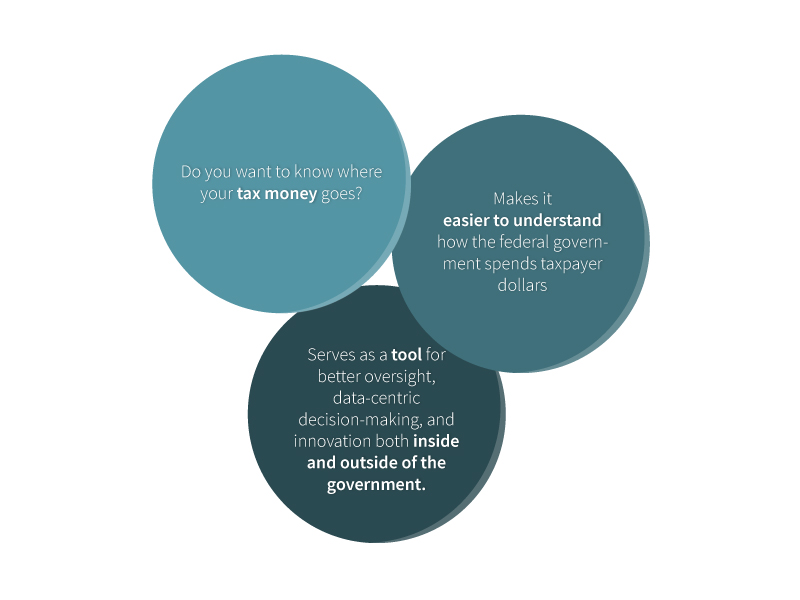
Transparency
- We provide insight into federal spending data through data-driven visualizations
- We provide access to federal spending data to everyday citizens
Human-Centered Design
- We conduct a user-research and testing to provide content that is interesting to users and use storytelling to help users to make a deeper connection with our content
Integrity
- We use credible data to tell objective stories allowing users to draw their own conclusions
- We are a trusted source and provide our analyses in a timely and relevant manner
Proces
This is optimal process; however, it does not apply it everyday challenges due to timeline, priority, pivot, and feedbacks.
1. Understand
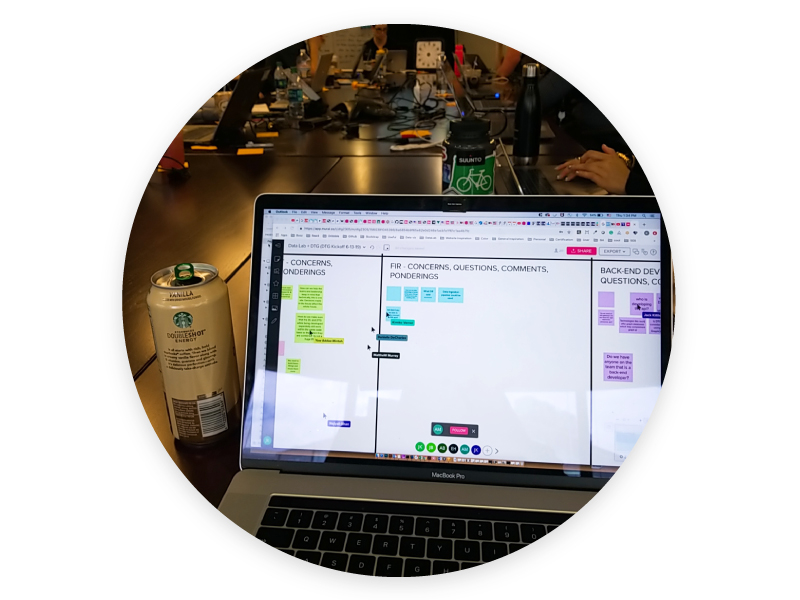
- Conduct brainstorm sessions with client
- Organize requirements from product manager
- Understand the problem for users and needs
Activities
– Kickoff Meeting – Get requirements and understand problems.
– Brainstorming Session – Gather and evaluate ideas and analyze requirements and users.
– Define Users – Define users, personas, and stories
Outcomes
Personas Requirements and Vision User Flows
2. Research
- Educate yourself and Research the topic
- Explore the markets and see how others is working on such features
- Get inspirations and idea from the competitiors
Activities
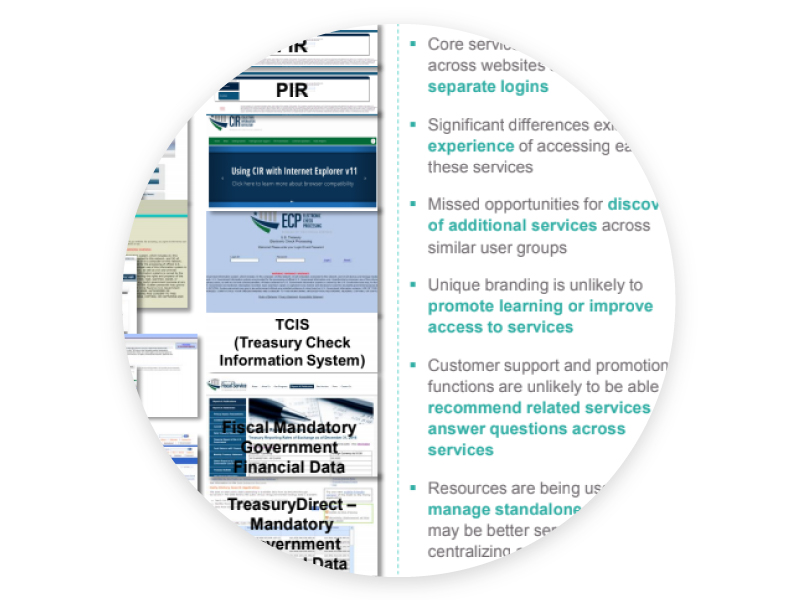
– Study – Study about the topic and competitors.
– Research similarities
– Understand the data – the analysis is very heavy data-driven, which require working closely with Data Analysts
– Research about types of visualizations
Outcomes
Ideas Competitive Analysis Research Findings
3. Wireframe
- Conceptiation
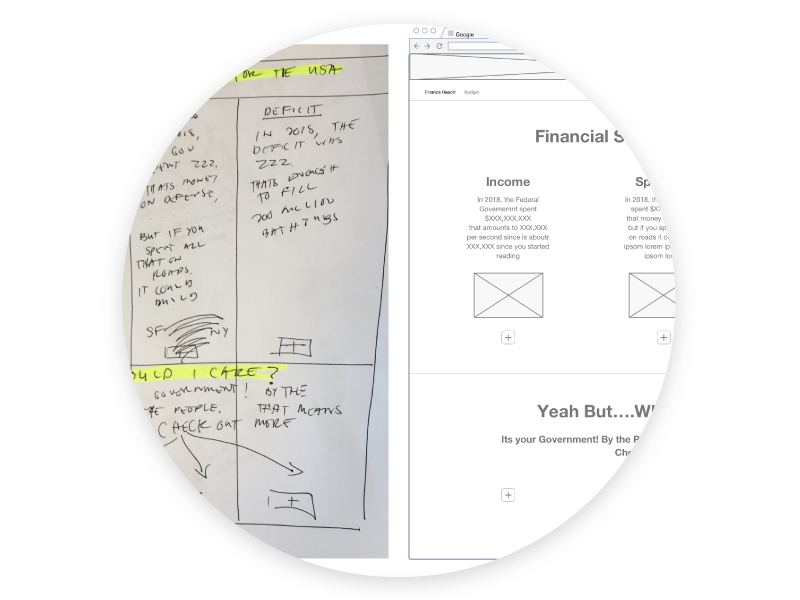
- Sketch and build intial wireframes
- Evaluate mockup and gather feedbacks
- Mobile First Approach
Activities
– Whiteboarding Sessions with Team excercise (e.g. Mule board, Sketch session, Features, Nice to have, Hypothesis)
– Generate intial mockups based on idea
– Iterative Process – Hypothesis / Design / Test(Feedbacks)
Outcomes
Sketches Mockups WireframesDemo with rough interactionUser Tasks
4. Design
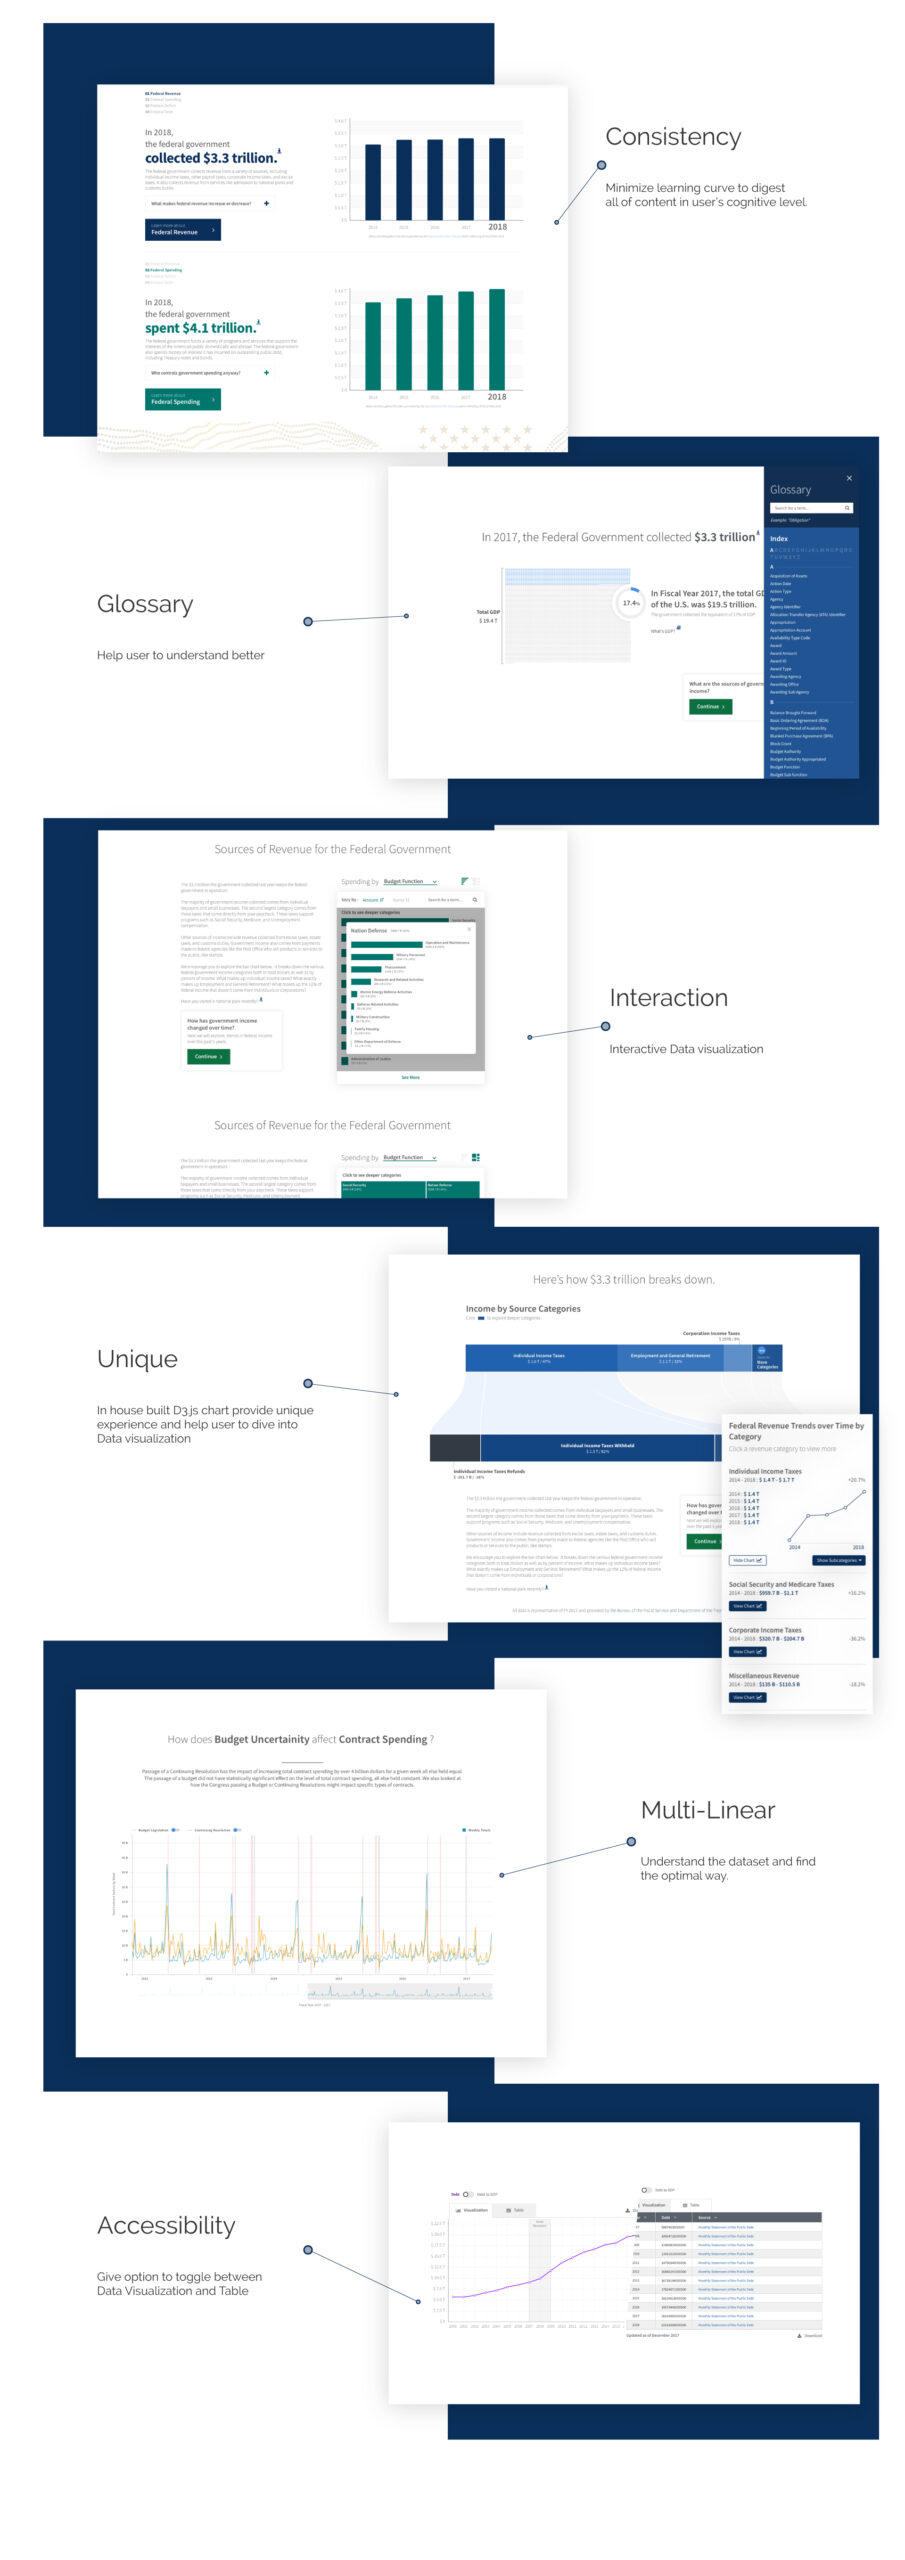
- Design System – Guidelines, colors, typography, Icons, grid
- Finalize Layouts and User Interfaces
- Wireframe ==> Lo-Fi & Hi-fi Mockups ==> Prototype
- Intuitive Design – always think of end users
- Gather technical review and refine level of effort(LOE)
- Responsive and Fluid layout for contents and visualizations
Activities
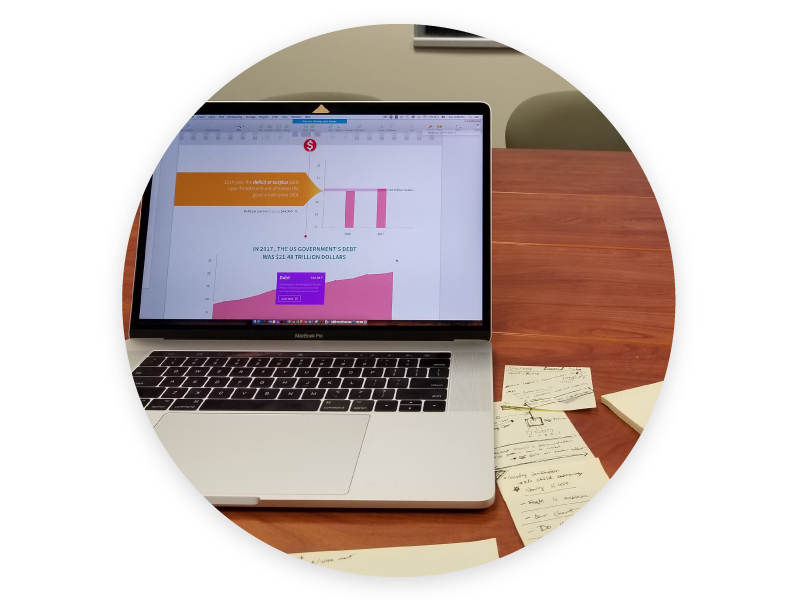
– Lo-fi & Hi-fi mockups – iterative process and incorporate feedback
– Define design specs, annotations, interactions for developments
– Finalize all of the screen elements and stay in the design system
– Technical review and QA with developers
– Review 508 Compliance and Accessibility Issues
Outcomes
Mockups Interactions Style elements(CSS/SCSS)Design Assets(Icons, Imagery)Prototype
5. Test
- Condudct usability testing – Task/Goal Driven
- Collect testing results
- Obeserve user’s behaviors (e.g. Frustration)
- Gather future ideas and improvements
Activities
– Usability Testing
– A/B Testing
Outcomes
User Feedbacks Improvement Lists

Takeaways
When I joined DataLab team, we were a very small team of 5 people (Data Analyst, Scrum Master, Front End Developer). At that time, our Product Owner (PO) from the Department of Treasury did not believe in the power of the design, he did not see the value of having a designer for the team.
While working closely with the PO, our team has been proven the value of design, shown the efficiency of work process, practiced the Human-centered design process, and now our team has +12 people. From the beginning to the current stage of experience in this project, there are challenges and solutions as follows:
Challenges
-
- Government data is very unclear and complex – Some of the terms are not commonly used by users (Ex. Receipts VS Revenue)
- Multi-layers of data categories – Some names are hard to recognize and lengthy as there are over 430 departments, agencies, and sub-agencies in the federal government (Ex. DOE is Department of Eenergy)
- Mobile Layout – Natural behavior of D3.js Data visualization, it’s hard to provide same deskop experience in mobile layout.
- Sudden pivot change from high rankers (how we depend on all of the feedback and stay our path – by user testing to back up our decisions)
- Multi channels – Multiple POs are giving different directions and Slow approvals process
- Accessibility – Limited color options. (e.g., Red – Republican Party / Blue – Democratic)
- Inconsistency on designs (From solo designer to 3+ designer team )
- Cross-functioning – There are 6 projects under the same umbrella. Each designer does not communicate enough, which creates a knowledge gap and inconsistency.
Solution
-
- Human Centered Design – Iterative Process – We are building a product for users, not for one person who we need to impress.
- Group Decision – Each PO/designer has different taste – try to choose the direction by group and user testings. Design team comes up with recommendation as a team instead of one person
- Design Freeze – Stay in the path what we promised and planned
- Systematic Design Process – Brainstorming / Wireframe / Lo-fi / Hi-fi / Prototype
- Be evangelist – Keep educating client for UX design process
- Retro – share idea / bring concern / behavior change / Lunch and Learn
- Monthly/ Bi-weekly meetup – Share the work and collect feedbacks from experts.
- Consistency on designs (From solo designer to 3+ designer team )
- Task and Feedbacks Management – Take a ownership and handle/organize task and feedabcks by priorities
Accomplishments
-
- Kudos from Secretary Mnuchin
- Product Owner promoted to Deputy Commissioner and won Gears of Government Award
- The design team grows from one to three
- Agile process / Scrum Framework – First successful case study in Government
- Our work was featured in 18F( Government Design Agency | Founder of USWDS)
- Building design system